Better debugging in LWC
Let's look at how to use console.dir() to debug LWC components better.
When you work with LWC you will very soon realise that it's all about objects.
You want to create a new record using LDS methods you would need an config object tha has info about the record input. If you want to update a record you need a config object that has info about the record that has to be updated. Same goes with navigation too.
And when you are actively developing the Web Components at times you might be interested in debugging the objects.
Until now you would have stringified it using JSON.stringify() and providing the object as the param to the method. The Browser is going to stringify the content of the object and it's going to show the content of the object in string notation.
We have an advantage and a disadvantage here. The advantage is, we can see the content of it and the disadvantage is the info we see is not going to be clear. If it's an object with 20+ properties then it becomes hard to check the content of the object.
That's where console.dir() comes to the rescue.
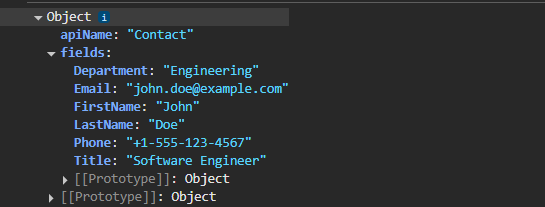
When we try to console the object using console.dir() the content of the object can be seen and also we can traverse across the object. We can expand collapse the keys of the object which is super duper handy.
Here am trying to log the content of the object head and this is what we get to see.
Hope this is helpful.
Happy debugging :p